Одним из наиболее распространенных анализов в клеточной биологии является экспрессия белка.
Это очень базовый инструмент в клеточной биологии, который может применяться для многочисленных биологических анализов, таких как:
и многие другие.
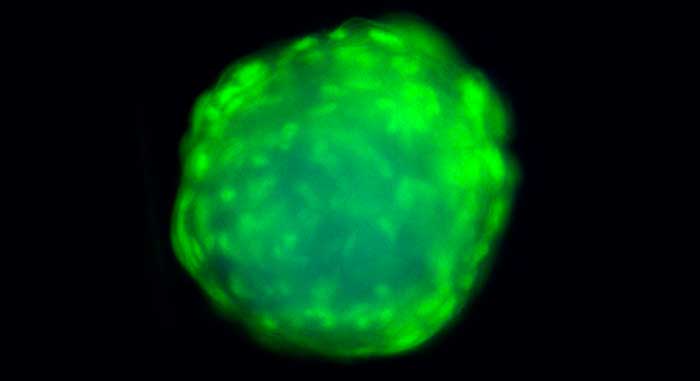
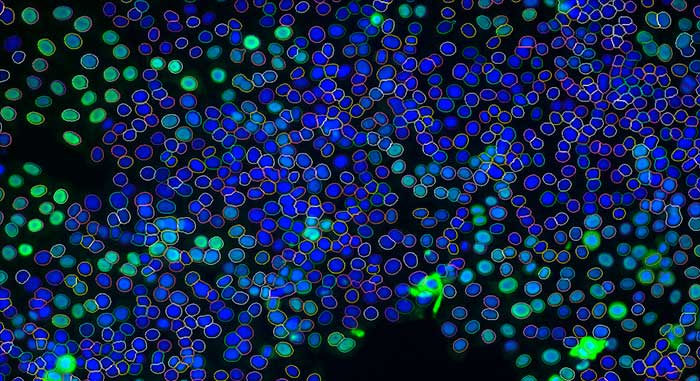
Количественная оценка интенсивности флуоресценции на клеточной основе с использованием ядерных и/или цитоплазматических маркеров.
Клетки на каждом изображении автоматически идентифицируются и измеряется интенсивность их флуоресценции.
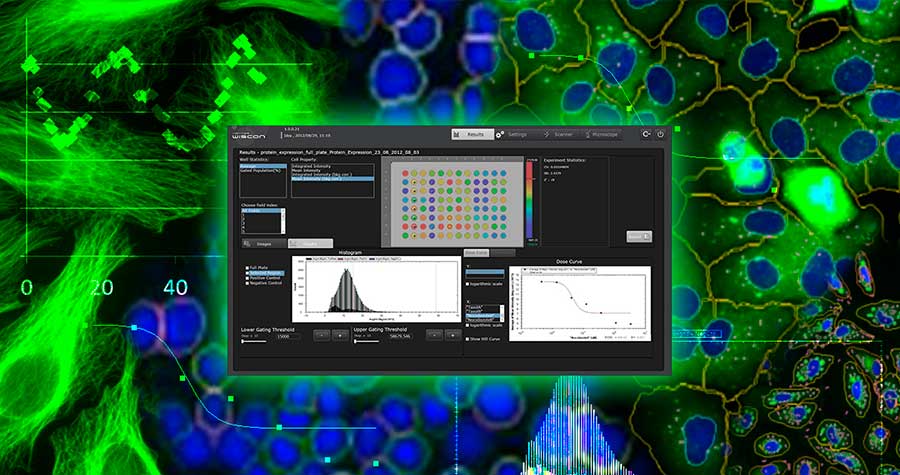
Быстрое и нетрудоемкое программное обеспечение WiSoft Athena Image Analysis позволяет пользователям быстро скринировать большое количество экспериментальных условий, например, при трансфекции, где в качестве показателя используется сравнительная экспрессия белка.
Тепловая карта, наложенная на планшет, представляет сравнительные результаты для интуитивной визуализации данных.
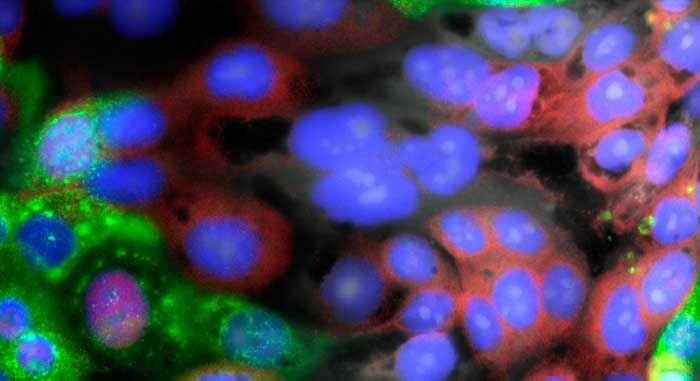
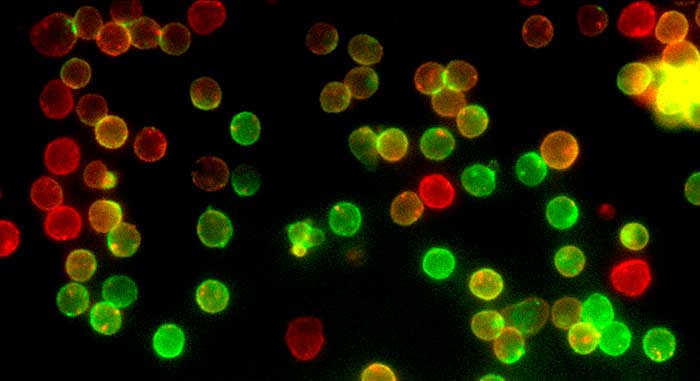
Позволяет одновременно изучать смешанные популяции.
Экспрессия белка подходит для таких анализов, как:
Приложение Protein Expression Athena применяется для определения жизнеспособности клеток (аутофагия), экспрессии белков и анализа фосфорилирования белков при исследовании рака молочной железы:
Источник:
Booth et al., Oncotarget, 26;9(5):6062-6074, Dec 2017
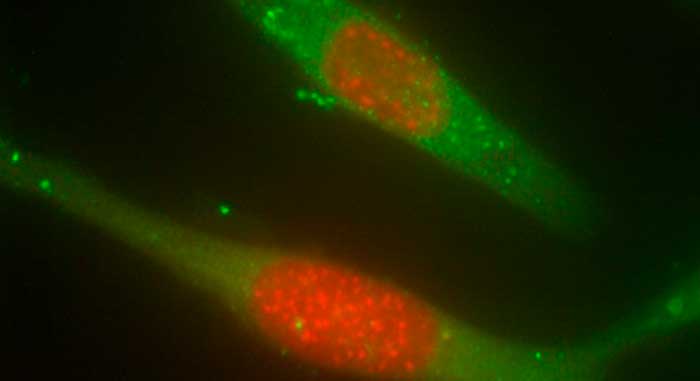
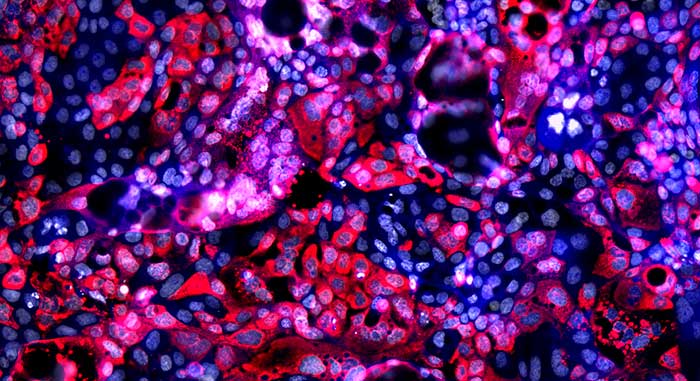
Препарат от рака молочной железы нератиниб блокирует функцию генов Ras, которые одними из первых были связаны с развитием рака.
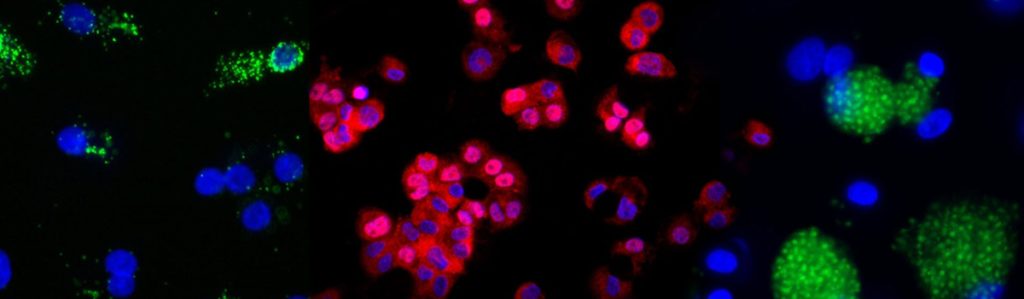
Анализ изображений показал, что нератиниб снижает экспрессию мутантного K-RAS и мутантного N-RAS.
Нератиниб и ингибиторы HDAC взаимодействуют для снижения экспрессии мутантного N-RAS и мутантного K-RAS. Клетки Spiky и PANC1, экспрессирующие мутантный N-RAS и мутантный K-RAS, соответственно, обрабатывали транспортным средством и нератинибом (50 нМ). Клетки фиксировали на месте и проводили иммуноокрашивание с контрпятном DAPI для определения уровня экспрессии и клеточной локализации N-RAS и K-RAS при увеличении 60× с помощью системы Hermes HCS.
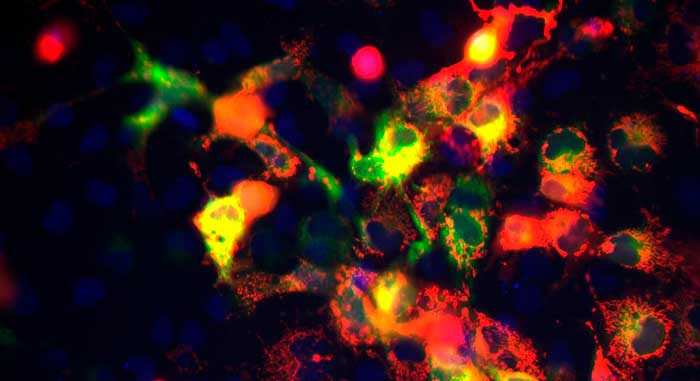
“In-Cell Westerns” Assay
Новый подход к обнаружению грубых изменений в экспрессии белков и их фосфорилировании
Источник:
Rationally repurposing Ruxolitinib (Jakafi®) as a solid tumor therapeutic
Tavallai Mehrad, Booth Laurence, Roberts Jane L, Poklepovic Andrew, Dent Paul ; Frontiers in Oncology ,vol.6,2016
Оценка общей экспрессии белка или посттрансляционных модификаций, таких как фосфорилирование, может быть выполнена с помощью измерения интенсивности флуоресценции. Такой «вестерн»-анализ в клетке использует непредвзятый запрограммированный электронный сбор данных, подобно тому, как это делалось в течение последних 45 лет с помощью SDS-PAGE и вестерн-иммуноблотинга.

В таблице выше приведены основные различия между обычным вестерн-блот анализом и экспрессией белков с помощью системы высококонтентной визуализации Hermes.
Tab Content